Page 5 - PowerPoint Presentation
P. 5
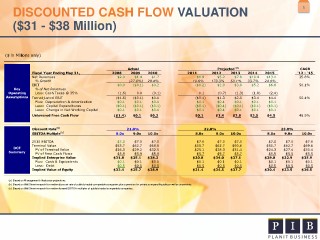
DISCOUNTED CASH FLOW VALUATION 5 ($31 - $38 Million) ($ in Millions only) Actual Projected (a) CAGR Fiscal Year Ending May 31, 2008 2009 2010 2011 2012 2013 2014 2015 '12 - '15 Net Revenues $2.0 $1.4 $1.7 $1.9 $5.2 $7.8 $10.4 $13.0 35.8% % Growth (27.0%) 20.4% 10.6% 173.3% 50.1% 33.7% 24.9% EBIT $0.0 ($0.1) $0.2 ($0.2) $2.0 $3.8 $5.2 $6.8 50.1% Key % of Net Revenues Operating Less: Cash Taxes @ 35% (1.6) 0.0 (0.1) 0.1 (0.7) (1.3) (1.8) (2.4) Assumptions Tax-adjusted EBIT ($1.6) ($0.1) $0.1 ($0.1) $1.3 $2.5 $3.4 $4.4 50.1% Plus: Depreciation & Amortization $0.1 $0.1 $0.1 $0.1 $0.1 $0.1 $0.1 $0.1 Less: Capital Expenditures ($0.1) ($0.1) ($0.1) ($0.1) ($0.1) ($0.1) ($0.1) ($0.1) Less: Change in Net Working Capital $0.1 $0.1 $0.1 $0.1 $0.1 $0.1 $0.1 $0.1 Unlevered Free Cash Flow ($1.4) $0.1 $0.3 $0.1 $1.4 $2.6 $3.5 $4.5 46.9% Discount Rate (b) 21.0% 22.0% 23.0% EBITDA Multiple (c) 8.0x 9.0x 10.0x 8.0x 9.0x 10.0x 8.0x 9.0x 10.0x 2015 EBITDA $7.0 $7.0 $7.0 $7.0 $7.0 $7.0 $7.0 $7.0 $7.0 Terminal Value $55.7 $62.7 $69.6 $55.7 $62.7 $69.6 $55.7 $62.7 $69.6 DCF PV of Terminal Value $26.0 $29.2 $32.5 $25.1 $28.3 $31.4 $24.3 $27.4 $30.4 Summary PV of Free Cash Flows $5.9 $5.9 $5.9 $5.7 $5.7 $5.7 $5.5 $5.5 $5.5 Implied Enterprise Value $31.8 $35.1 $38.3 $30.8 $34.0 $37.1 $29.8 $32.9 $35.9 Plus: Cash & Equivalents $0.1 $0.1 $0.1 $0.1 $0.1 $0.1 $0.1 $0.1 $0.1 Less: Debt $0.5 $0.5 $0.5 $0.5 $0.5 $0.5 $0.5 $0.5 $0.5 Implied Value of Equity $32.4 $35.7 $38.9 $31.4 $34.5 $37.7 $30.4 $33.5 $36.5 (a) Based on M anagement's likely case projections. (b) Based on Wall Street research for median discount rate of publicly traded comparable companies plus a premium for private company illiquidity as well as uncertainty. (c) Based on Wall Street research for median forward EBITDA multiples of publicly traded comparable companies.