Page 4 - PowerPoint Presentation
P. 4
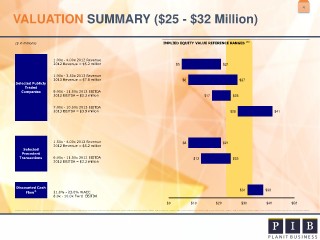
4 VALUATION SUMMARY ($25 - $32 Million) ($ in millions) IMPLIED EQUITY VALUE REFERENCE RANGES (a) 1.00x - 4.00x 2012 Revenue 2012 Revenue = $5.2 million $5 $21 1.00x - 3.50x 2013 Revenue 2013 Revenue = $7.8 million $8 $27 Selected Publicly Traded Companies 8.00x - 11.50x 2012 EBITDA 2012 EBITDA = $2.2 million $17 $25 7.00x - 10.50x 2013 EBITDA 2013 EBITDA = $3.9 million $28 $41 1.50x - 4.00x 2012 Revenue $8 $21 2012 Revenue = $5.2 million Selected Precedent Transactions 6.00x - 11.50x 2012 EBITDA $13 $25 2012 EBITDA = $2.2 million Discounted Cash Flow © 21.0% - 23.0% WACC $31 $38 8.0x - 10.0x Fwrd EBITDA $0 $10 $20 $30 $40 $50